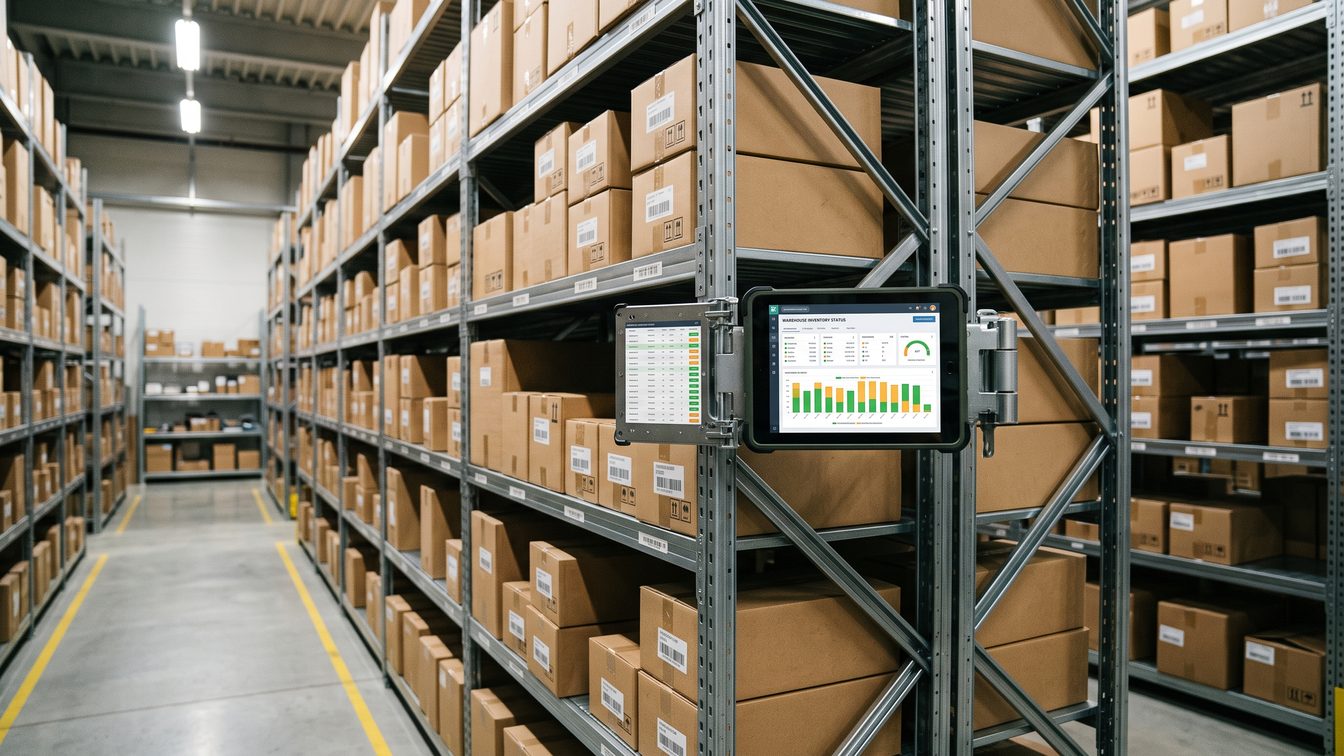
The average Shopify store under $2M loses 8 to 12% of annual revenue to stockouts. Not because the products are discontinued. Because the restock alert fired after the last unit shipped, the supplier needs 5 to 14 days to fulfill, and every day without inventory is a day your competitor captures that customer. Anthropic's new merchant agent blueprint includes back-end inventory management as a core capability. Here is how to build the restock intelligence layer in 90 minutes.
- Standard Shopify low-stock alerts are threshold-based (fire at a fixed number) and ignore sales velocity, seasonality, and supplier lead times
- An AI-powered restock system predicts when you will run out based on trailing sales data and factors in each supplier's lead time before alerting
- For a $1M Shopify store, reducing stockouts by 40% recovers $80,000 to $120,000 in annual revenue
- The build uses Shopify API plus Claude for demand analysis. Total API cost: $15 to $30 per month
Why Standard Alerts Fail
Shopify's built-in low-stock notification works like this: you set a threshold (say 10 units). When inventory hits 10, you get an email. The problem is that a threshold of 10 means something completely different for a product that sells 2 units per day (5 days of runway) versus a product that sells 15 units per day (16 hours of runway).
The threshold also ignores supplier lead times. Your domestic supplier ships in 3 days. Your overseas supplier ships in 14 days. Both products hit the threshold on the same morning. One can be restocked before you run out. The other is already too late.
Most ecom operators solve this by setting conservative thresholds (reorder at 50 units instead of 10), which ties up cash in excess inventory. Or they set aggressive thresholds and eat the stockouts. Neither is a system. Both are guesses wearing a number.
When I spent years in capital markets through Angel Investors Network, one of the recurring patterns was investors who mistook a lagging indicator for a leading one. They watched the stock price instead of the order book. Inventory thresholds are lagging indicators. Sales velocity is the leading indicator. Build your alerts on the leading one.
The Three Components
Component 1: Sales velocity tracker. Pull the last 90 days of sales data per SKU from Shopify's API. Calculate trailing 7-day, 14-day, and 30-day average daily sales. Weight the 7-day average highest because recent trends matter more than quarterly averages. Flag any SKU where the 7-day velocity exceeds the 30-day velocity by more than 50% (demand spike: reorder window just shortened). Component 2: Supplier lead-time database. Build a simple spreadsheet or database table with one row per supplier: supplier name, average lead time in days, reliability score (percentage of orders delivered on time over the last 12 months). For suppliers with unreliable delivery, add a buffer multiplier (1.3x for 80% on-time, 1.5x for 70% on-time). This takes 20 minutes to populate and rarely changes. Component 3: The AI restock engine. Claude reads the sales velocity data and the supplier lead-time database. For each SKU, it calculates: days of inventory remaining (current stock divided by 7-day velocity), reorder trigger date (today plus supplier lead time plus buffer), and recommended order quantity (14-day velocity multiplied by lead time, rounded up to the supplier's minimum order increment). When days remaining drops below the reorder trigger window, the system fires an alert with the recommended PO quantity and the supplier contact.The 90-Minute Build
Minutes 1 to 30: Set up the Shopify data pull. Use Shopify's Admin API to pull current inventory levels and the last 90 days of order line items. Group by SKU. Calculate the velocity metrics. If you are not comfortable with the API, use a Shopify app like Inventory Planner as the data source and export to CSV. Minutes 30 to 50: Build the supplier database. Open a Google Sheet. Three columns: Supplier, Lead Time (Days), On-Time Rate. Populate from your last 12 months of PO history. If you do not have clean records, call each supplier and ask for their stated lead time. Add 30% to whatever they tell you. That is your working number. Minutes 50 to 75: Wire the AI analysis. Connect the Shopify data and supplier Sheet to Claude via the Skills API (GA since August 20, 2026). The skill reads both data sources, runs the restock calculation, and produces a daily report listing every SKU within its reorder window. Set the output format: SKU, current stock, daily velocity, days remaining, recommended order quantity, supplier name, PO deadline. Minutes 75 to 90: Schedule delivery. Set the analysis to run daily at 6 AM. Deliver the report via email, Slack, or both. Configure critical alerts (any SKU under 3 days of stock) to send immediately via SMS in addition to the morning report.The Revenue Recovery Math
Let us run the numbers on a $1M annual revenue Shopify store with 200 active SKUs.
Industry data shows the average ecom store experiences stockouts on 5 to 8% of SKUs at any given time. For a $1M store, that represents $50,000 to $80,000 in potential lost revenue per year, not counting the compounding effects of lost customer lifetime value and reduced search ranking.
| Metric | Before | After AI Restock |
|--------|--------|------------------|
| Average stockout rate | 6% of SKUs | 2 to 3% of SKUs |
| Revenue lost to stockouts | $60,000/year | $20,000 to $30,000/year |
| Excess inventory (over-ordering) | $40,000 tied up | $15,000 to $20,000 tied up |
| Revenue recovered | — | $30,000 to $40,000/year |
| Cash freed from excess inventory | — | $20,000 to $25,000 |
| Net annual benefit | : | $50,000 to $65,000 |
| Monthly AI cost | : | $15 to $30 |
The payback period is not measured in months. It is measured in days. The first prevented stockout on a $500 product pays for two years of API costs.
SmallBiz.ai models a similar workflow ("Turn Completed Jobs Into Invoices") at 15 hours per month saved. The inventory version saves fewer hours but recovers more dollars because stockout costs compound through lost customers and lower search visibility.Advanced: Seasonal Demand Modeling
Once your basic restock system runs for 90 days, add a seasonal layer. Claude reads the same SKU data but now includes year-over-year comparisons. If a product sold 3x more in October last year, the system preemptively flags it for early reorder in September.
This matters for holiday seasons, product launches, and marketing campaigns. If you are planning a 20%-off promotion on your top seller, tell the restock system. It will adjust the velocity forecast and move the reorder trigger forward to account for the demand spike.
The FOCUS Strategy framework applies here. You are not trying to predict demand for 200 SKUs with equal precision. You are finding the 20 to 30 SKUs that drive 80% of revenue and building the strongest possible demand model for those. The long tail gets a simple threshold. The revenue drivers get AI-powered velocity tracking.
What to Watch For
False velocity spikes. A SKU that jumps from 2 units per day to 20 might be a viral moment. Or it might be a bulk order from a single customer that will not repeat. The system should flag any velocity spike that comes from fewer than 5 distinct customers. If one customer drove the spike, do not reorder 10x your normal quantity. Supplier lead-time drift. Your supplier said 7 days. You have been receiving in 7 days. Then they restructure their warehouse and it becomes 12 days. Your system still assumes 7. Run a quarterly audit: actual receipt date minus PO date for every order, compared to the stated lead time. If the gap exceeds 2 days, update the database. Dead stock masquerading as safety stock. Some operators keep 60-day buffers on products that sell 1 unit per week. That is not safety stock. That is $3,000 sitting in a warehouse generating zero return. The AI restock system should flag any SKU with more than 45 days of inventory at current velocity as a cash-efficiency issue.The Doctrine Connection: Verification Beats Optimism
Every ecom operator has said "I think we have enough stock" at least once and been wrong. The optimistic guess costs more than the system that replaces it. A restock engine that reads real velocity data, factors in real lead times, and fires alerts based on math instead of memory is not a nice-to-have. It is the difference between knowing and hoping.
Verification beats optimism. Build the system. Trust the data. Reorder on the numbers, not the gut.
Frequently Asked Questions
How is this different from Shopify's built-in inventory alerts?
Shopify alerts fire at a fixed threshold you set manually. They do not adjust for sales velocity, supplier lead times, or seasonal demand. The AI restock system calculates when you will run out based on actual sales data and alerts you early enough to reorder before the stockout happens.
What does it cost to run an AI-powered restock system?
Claude API costs for daily inventory analysis on 200 SKUs run $15 to $30 per month. The Shopify API is free on paid Shopify plans. The supplier database is a free Google Sheet. Total monthly cost: under $50. Total annual cost: under $600 against $30,000 to $65,000 in annual benefit.
Can this work with platforms besides Shopify?
Yes. Any ecom platform with an API that exposes inventory levels and order history (WooCommerce, BigCommerce, Magento, Amazon Seller Central) works with the same architecture. The data pull script changes. The AI analysis logic stays the same.
How accurate is the demand prediction?
The system does not predict demand. It extrapolates from trailing velocity data. For stable-demand products (consumables, basics), the extrapolation is accurate within 10 to 15%. For trend-driven products (fashion, seasonal), accuracy drops without the seasonal adjustment layer. Add the seasonal layer after 90 days of baseline data.
Should I use Inventory Planner or similar apps instead?
Inventory Planner, Stocky, and similar apps are good for stores that want a plug-and-play solution. The AI approach is better for stores that want customized logic (different lead-time buffers per supplier, campaign-aware velocity adjustments, cross-SKU demand correlation). If your needs are standard, the app is faster. If your supply chain has nuance, build the AI layer.
Jeff Barnes has no personal position in any company, fund, or platform named in this article. demg.ai provides marketing education and systems consulting, not investment advice.