
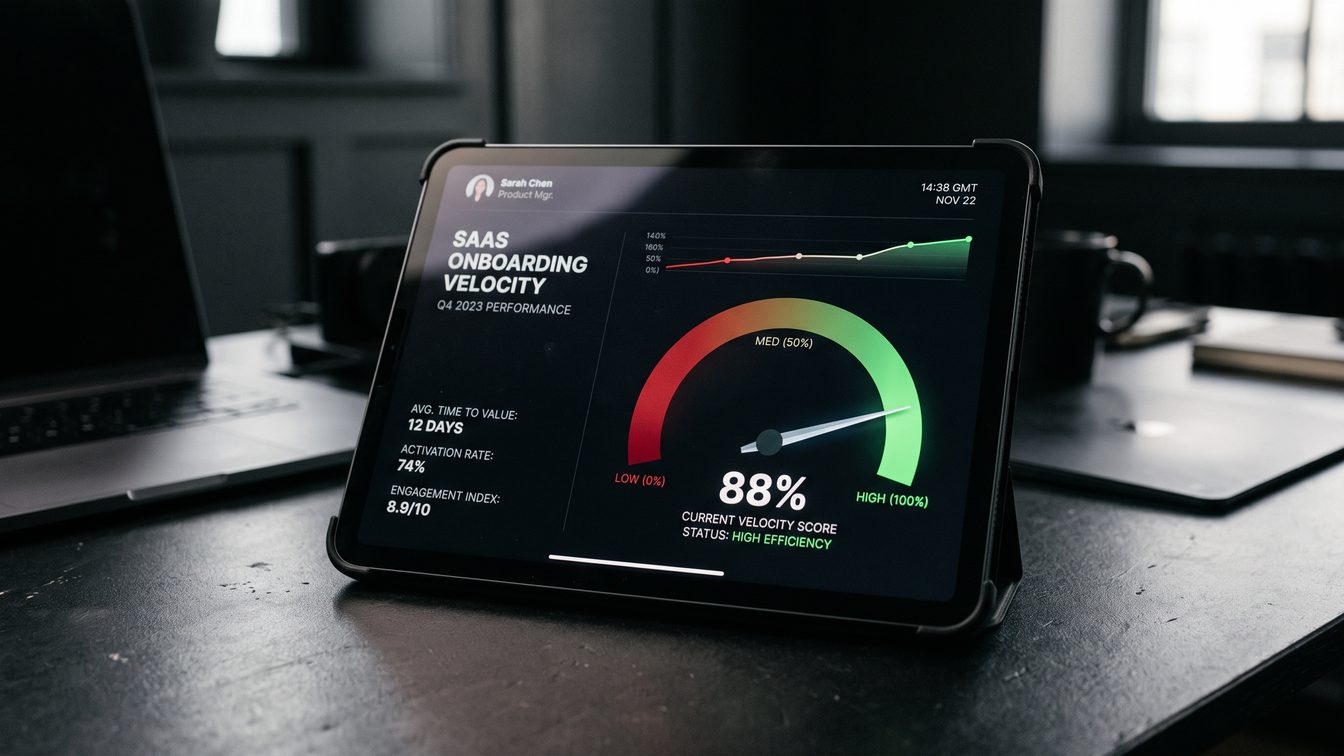
The Signal Is Already There
Sixty to seventy percent of annual SaaS churn happens inside 90 days. Most concentrated in the first 30. Not because the product is broken. Because the customer never felt it work.
You have a 14-day window to move the needle on retention. After that, the odds flip against you. Customers who reach first value inside 14 days retain at 80 percent at month 12. Customers who miss that milestone inside 30 days? 35 to 50 percent retention. That is a 30 to 45 point swing on a single input variable.
The question is not whether your product works. The question is whether your customer experiences it working before they stop logging in.
Why First-Week Behavior Predicts Month-Three Churn
Churn decisions form early. Research from ProductQuant and Amplitude shows two-thirds of new SaaS users never complete the activation milestone at all. The customers who do, the ones who reach a measurable outcome in their first week, move off the churn track.
Behavior crystallizes intent. By day three, you know if someone is building a habit or testing a hunch. By day seven, the commitment signal is clear.
I watched this play out inside insurance underwriting at Hartford Steam Boiler, scouting for Munich Re's innovation arm. Underwriters see signal density. A claims file lands. They scan the first two pages. By page three, they have decided. The rest is documentation.
Customer onboarding works the same way. First-week behavior is the underwriter's signal.
The Onboarding Velocity Score: Four Signals
Build a composite score. Weight it to your product's value driver.
Signal One: Time-to-First-Value (35% weight)
This is not onboarding completion rate. It is the elapsed time from sign-up to the first observable activation event.
For product-led SaaS, top quartile is under 24 hours. For self-serve with team configuration, under 48 hours. For sales-assisted, under seven days.
Scoring: 0 to 24 hours = 90 points. 24 to 48 hours = 75 points. 48 to 72 hours = 50 points. Beyond 72 hours = 25 points.
Signal Two: Feature Activation Sequence (25% weight)
Not all activations are equal. A customer who sequences through three to five key features in deliberate order signals intentionality.
Map your happy path. Define the feature sequence that leads to value. Then measure whether new users follow it. Random clicking is trial. Methodical progression is task completion.
Scoring: Completing one feature = 30 points. Three features in order = 60 points. Full sequence in order = 100 points.
Signal Three: Support Ticket Patterns (20% weight)
This is counterintuitive. A support ticket is not failure. It is a signal that someone cares enough to ask for help.
Users submitting help-seeking tickets in week one are engaging. They are checking boxes. These users stay. Users going silent are the risk.
Scoring: Feature or usage questions = +15 points each (capped at 50). Bug reports = +10 points each (capped at 30). No contact at all = 0 points.
Signal Four: Login Cadence (20% weight)
The calendar does not lie. Users who come back on day two, day four, and day six are building habit. Users who log in once and disappear are time-wasters.
A user with four logins in week one is sixteen times more likely to be active in week four than a user with one login.
Scoring: One login = 20 points. Two logins = 40 points. Three to four logins = 70 points. Five or more = 100 points. Bonus for distributed logins: +20 points.
Assembling the Score
OVS = (TTFV score times 0.35) + (Feature sequence times 0.25) + (Support engagement times 0.20) + (Login cadence times 0.20)
Score bands:
- OVS 85 to 100: Expansion-ready. Move to upsell.
- OVS 70 to 84: Stable trajectory. Standard nurture.
- OVS 50 to 69: Intervention zone. Trigger personal outreach.
- OVS below 50: High churn risk. Activate rescue motion or accept the loss.
The Math
Customers reaching first value inside 14 days retain at 82 percent at month 12. Slow-activated customers sit at 42 percent. That is a 40-point delta from one variable.
Adding three more variables amplifies the signal. Login frequency by day seven explains 70 percent of 30-day churn variance. Combining these signals gives you an 80-plus percent accuracy band on 90-day churn prediction.
This is your asset class. You are not guessing retention. You are reading it off the balance sheet.
Data's DNA: What Customer Signals Leave Behind
Customers do not churn in the dark. They leave signals. Behavioral DNA.
Every onboarding path contains an intent signal (did they complete value-delivery action?), a habit signal (did they return more than once?), a clarity signal (did they follow the happy path?), and a friction signal (did they ask for help or drop off?).
These signals compound weekly. By day seven, you have enough signal density to predict day 90.
Operationalizing the Score
Step One: Define Your Activation Milestone. Which action in week one correlates strongest with month-three survival? Run a cohort analysis. Make that your milestone.
Step Two: Instrument Four Data Streams. Timestamp of activation event. Feature event stream. Support ticket metadata. Login timestamps. Most products already log this.
Step Three: Calculate Weekly. Pull scores every Monday. Identify churn candidates by Tuesday. Trigger interventions by Wednesday.
Step Four: Intervene by Tier. Expansion tier: introduce premium features. Stable: weekly check-ins. Intervention: personal outreach, fix one blocker. Churn: cost-benefit decision.
FAQ
Q: What if my product does not have an obvious activation milestone?
Then you have a product problem, not a metrics problem. Work backward from your stickiest customers. What did they do in week one that others did not? That is your milestone.
Q: How do I weight the score for different buyer types?
Run the OVS formula for each segment separately. A self-serve buyer might weight TTFV and login cadence higher. An enterprise buyer might weight feature sequence and support engagement.
Q: Can I automate scoring and interventions?
Scoring is automated. Interventions depend on your motion and CAC. For high-ACV customers, personal outreach at OVS 60 is justified. For low-ACV, use in-app messaging.
Q: What if a customer scores low in week one but high in week two?
Velocity matters. Improvement is signal too. Incorporate week-over-week delta as a separate scoring component.