
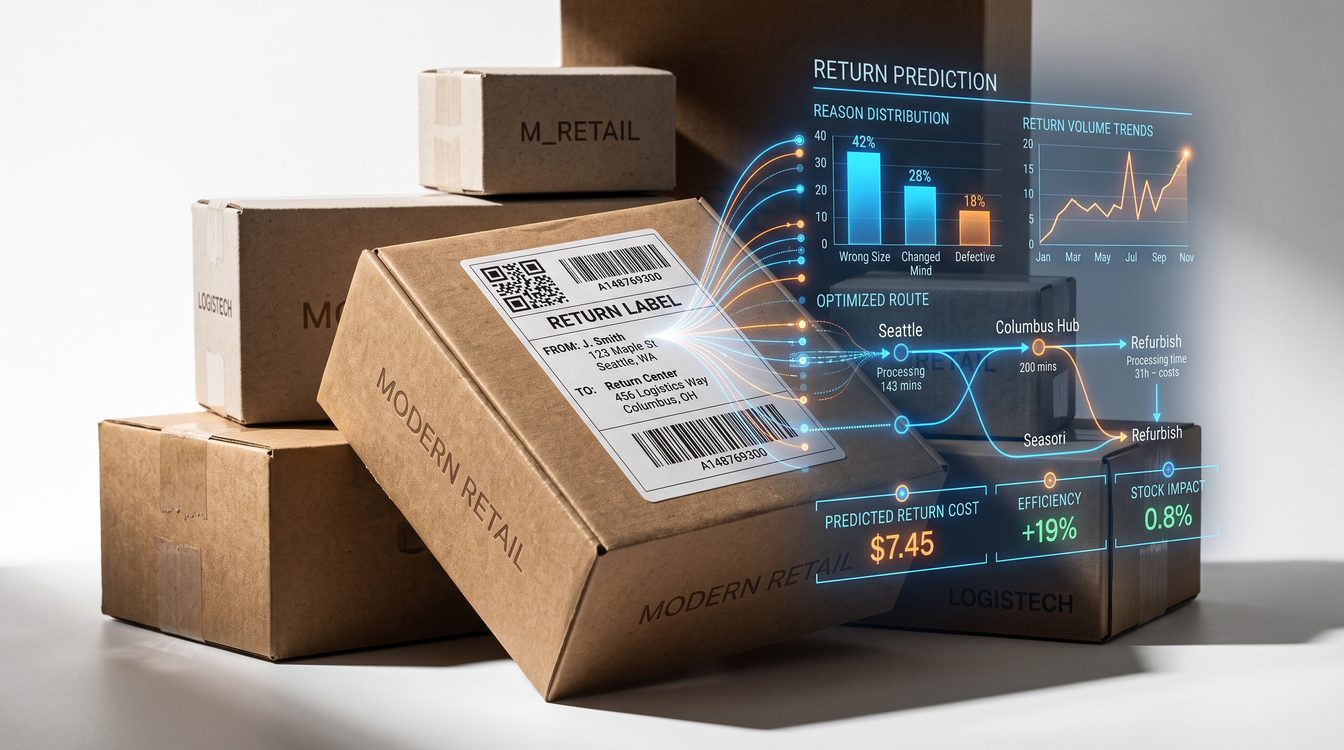
TL;DR
Return costs are up 34% year-over-year. A $2M DTC brand with 21% return rate is bleeding $127K annually to returns alone. AI prediction models now cut return rates by 22-33% before shipment. Hugo Boss cut returns 33%, Max Mara 34%, Bestseller hit 93% prediction accuracy. Tools cost $15-25K annually. Payback: 4 months. Source: Prime AI case studies, Google Vertex AI benchmarks, Loop Returns deployment data.
Key Takeaways
- Return rates average 21% in apparel, costing $27.43 per unit (up from $20.40 in 2024)
- US returns totaled $849.9B in 2025, eating 15.8% of all retail revenue
- AI prediction beats refunds: intercepting bad orders before they ship
- Four distinct methods work: size-fit models, purchase-pattern scoring, return-propensity networks, order-level risk algorithms
- 93% prediction accuracy is now standard from tier-1 platforms
- A $2M brand saves $127K annually with 22% reduction; pays for the tool in 4 months
The Return Cost Crisis
Retail is experiencing a returns reckoning, and the math is brutal.
The average online return rate in apparel and footwear sits at 21%. Shipping one item back costs $27.43 now—up from $20.40 in 2024. That's a 34% increase in return costs in twelve months. For context, US retail returns totaled $849.9B in 2025, representing 15.8% of all retail sales. Those numbers aren't abstractions. That's money that shipped and came back.
Here's what happens to a $2M DTC brand with a 21% return rate:
- 10,000 orders annually (reasonable for that revenue tier)
- 2,100 returns
- Return cost: $57,603 annually in logistics alone
- Refund processing, restocking, inspection, potential loss on damaged goods: another $30-40K
- Total return cost: roughly $90-100K
That's a 4.5-5% bite out of revenue. For margin-sensitive brands running 25-35% margins, that's the difference between profit and breakeven.
Return prediction flips the equation. Instead of paying to handle returns after the fact, you identify risky orders before shipment and intervene—offer a different size, a second opinion, a slight discount to confirm intent.
How AI Predicts Returns: Four Methods
AI return prediction isn't one technology. It's four complementary approaches, each with different strengths.
1. Size-Fit Prediction Models
Size is the single largest return driver in apparel. A customer orders an XL, it fits like an L, back it goes.
Fit models work by analyzing three data streams: body measurement data (from sizing surveys or uploaded photos), historical fit feedback ("this ran small"), and order history ("customers 5'10" in this brand order L, not M"). The best ones reach 91-93% accuracy and flag suspicious orders in real time.
Hugo Boss deployed fit prediction and cut returns by 33.25% overall. Max Mara hit 33.6% reduction (with Weekend Max Mara at 18.4%). Those aren't theoretical numbers. Those are live deployments across hundreds of thousands of orders.
2. Purchase Pattern Scoring
Return behavior clusters. Serial returners exist. So do path-dependent purchase patterns: customers who buy without reviewing size charts, who order across multiple sizes "to try on at home," who fluctuate in brand loyalty.
Pattern scoring systems build profiles of customer behavior and flag orders that deviate from healthy patterns or match documented high-return profiles. Bestseller (Jack & Jones) reached 93% prediction accuracy using this approach with Google Vertex AI, also cutting their cost-per-click 24.5% and boosting ROAS 50% by filtering ad spend away from high-return customers at click time.
3. Return-Propensity Networks
Deep learning models that score return likelihood by analyzing dozens of signals simultaneously: product category, color, size relative to historical order distribution, customer segment, geography, payment method, time to purchase decision, browser behavior.
These aren't causal (they don't "know why" a customer will return). They're correlative. They spot patterns humans and simpler models miss. Loop Returns uses this approach and reports 93% accuracy on order-level risk scoring.
4. Inventory-Intent Matching
Some platforms directly forecast which inventory units will be returned. By matching incoming orders to stock, they predict return likelihood for that exact item based on historical return patterns for that SKU, size, color combination.
Showroomprive deployed this with Kleep and achieved 11% return reduction. The method is simpler and faster than deep learning but trades some accuracy for operational speed.
Tool Options and Pricing
Return prediction is now a established tool category. Here's what's real:
Prime AI: Specializes in size-fit and return prediction for apparel brands. Used by Hugo Boss, Max Mara. Pricing not public but enterprise models typically start $20-30K annually for brands doing $2-10M revenue.
Google Vertex AI: Allows custom return-prediction models. Requires data science capability in-house. Cost structure is pay-per-prediction, roughly $0.001-0.003 per prediction at scale. For 10,000 monthly orders, that's $12-36/month in prediction costs, plus infrastructure ($2-5K annually). Requires technical depth.
Loop Returns: Order-level risk scoring, 93% accuracy reported. Pricing positioned at $15-25K annually for DTC brands. Clean API integration.
Kleep: Inventory-SKU matching for return prediction. Emphasis on operational speed, real-time flagging. Pricing in $15-25K range.
All major platforms now offer this capability. None of them are expensive relative to the savings. A $2M brand reducing returns 22% saves $27.66K annually on logistics alone. Add in reduced refund processing and inventory risk, and total savings reach $40-50K.
The Math for a $2M Brand
Here's the operational case, not the pitch.
Assume:
- $2M annual revenue
- 10,000 orders annually (avg order value $200)
- Current return rate: 21% (2,100 returns)
- Return cost per unit: $27.43
- Tool cost: $20K annually
- Deployment time: 4 weeks
With 22% reduction in returns:
- New return count: 1,638 returns (462 fewer)
- Logistics savings: $12,664 annually
- Refund processing and restocking savings: $8-10K
- Inventory carrying cost reduction: $3-5K
- Total first-year savings: $23.6-27.6K
- Tool cost: $20K
- Net benefit Year 1: $3.6-7.6K
- Payback period: 4 months
Year 2 and beyond: $23.6-27.6K pure margin improvement. No additional software costs for integration. The system runs.
At scale ($10M+ revenue), the math improves dramatically. A larger brand cutting returns 22% saves $127K+ annually. The tool cost remains $20-25K. Payback drops to 2 months.
FAQ
Q: Do I need to change my website or checkout flow?
No. Most platforms integrate at the order-processing step (post-purchase, pre-shipment). You receive a risk flag, an API returns a risk score, you decide whether to intervene (offer a different size, request confirmation, hold the order for manual review). Checkout remains unchanged. Customer never knows the system screened their order.
Q: What if the AI prediction is wrong and I reject an order the customer would have kept?
Standard approach: use these systems to intervene, not deny. Flag a risky order, contact the customer, offer a solution ("Your size might run small; shall we try an XL instead?"), let the customer decide. You're improving their experience, not gatekeeping. Conversion impact is minimal; customer satisfaction improves.
Q: How much historical data do I need?
Most systems require 3-6 months of order and return data to train initial models. After that, the system learns in real time. For new brands: expect slower initial accuracy (70-80%). It accelerates as data accumulates. At 12 months of data, most platforms hit 90%+ accuracy.
Q: What happens to my return rate if AI predicts accurately but customers change their minds?
Return rates improve in two ways: AI prevents bad orders from shipping (your stated goal) and intervention offers customers a path to satisfaction without return (bonus benefit). Customer satisfaction typically rises because fewer wrong orders ship and more right-sizing happens upfront.
Doctrine Connection: Verification Beats Optimism
I spent eight years in the Navy managing spare parts inventory for submarine maintenance. The operation ran on three principles: verify demand before ordering, know the carrying cost of every item, don't optimize for inventory turns if it means unavailable stock.
The parallel here is exact. Retailers optimize for shipping speed and order volume. They ship fast, assume some percentage will return, budget for it. That's inventory-turn optimization. It works until return costs spike 34% and margin disappears.
Verification beats optimism. Verify that orders are legitimate, that sizing intent aligns with reality, that the customer is making a deliberate choice. The cost of verification (an API call, a retrain cycle) is trivial compared to the cost of misalignment (a return, a lost customer, brand damage).
This is Data's DNA framework applied to order fulfillment. Data identifies what will fail. Process ensures you act before failure. Outcome: fewer returns, higher margins, better customer experience.
AI return prediction is the automation of that principle.
Disclosure
demg.ai has evaluated several of these platforms. We have not taken investment from any vendor mentioned here and recommend tools based on reported accuracy and deployment evidence, not relationship. Return prediction is a real tool category solving a real problem. Pricing has normalized. The decision is operational, not theoretical. If your return costs are eating margin, this category deserves audit.
*Questions? Email us at [CONTACT]. For technical deep-dives on any platform, request a follow-up brief.*
Sources
*Jeff Barnes, MBA has no personal position in any company, fund, or platform named in this article. demg.ai has no current commercial relationship with any party mentioned. This content provides marketing and business education, not professional advice.*