
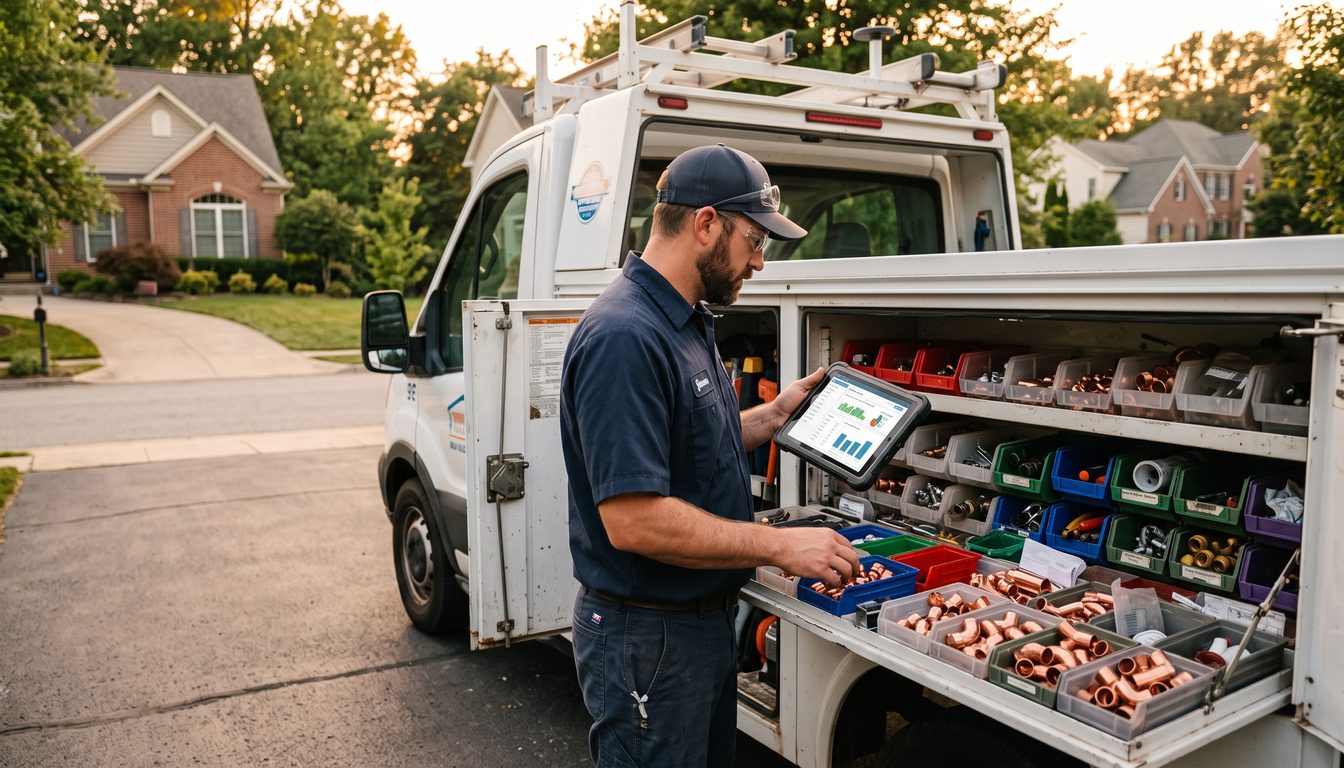
TL;DR: Katy Plumbing saved $750K in inventory carrying costs and recovered $1-2M in lost revenue through min/max automated inventory. One technician generates $287-$410 in losses per stockout incident (4.7 per week baseline). Automated systems reduce stockouts 68%. ROI timeline: 6-12 months. This is your next bottleneck.
Your technicians are walking time bombs for lost revenue.
Here's the incident: A plumber shows up to a customer's house. Needs a 2-inch copper coupling. Doesn't have it in the van. Goes back to the shop. Shop doesn't stock it. Orders it for tomorrow. Customer gets angry. Job doesn't close. Technician sits idle. Revenue dies.
Katy Plumbing documented this. Found it happening 4.7 times per technician per week. Each incident costs $287-$410 in lost productivity and customer dissatisfaction. Twenty technicians. That's $55,000 per week in friction.
They implemented automated min/max inventory prediction. System learned what parts each technician actually uses. Built predictive stock levels. When inventory hit the min threshold, the system ordered automatically. Van stock got pre-positioned for forecast demand.
Result: stockout incidents dropped 68%. Recovered revenue: $1-2M annually. Reduced carrying costs: $750K. Net benefit: $1.75M per year.
I watched submarine crews run casualty drills. The difference between a crew that survives a casualty and one that doesn't is prep. Spare parts staged. Procedures documented. Muscle memory practiced.
Katy Plumbing ran the inventory equivalent of a casualty drill. They prepped. They documented. They automated.
You're running the same play with worse data.
The Baseline: What You're Losing
Your technician load-outs are guesses.
You've got maybe 30-40 part types in the van. You've got experience saying "I usually need three couplings, six valves, two water heaters." That's the system. Experience beats data.
Here's what you're actually losing:
Incident Cost: $287-$410 per stockout
- Technician productivity lost: 1.5 hours ($120 at $80/hr fully loaded)
- Vehicle trip cost to re-stock: $60
- Customer dissatisfaction: $50-100
- Lost close/upsell: $100-200
One incident. Per technician. 4.7 times per week.
You've got 10 technicians. That's 47 incidents per week. That's $13,489-$19,270 per week in friction. That's $700K-$1M per year.
And you think it's normal. "This is the business."
Parts Carrying Costs: $400-$600K annually for mid-size contractor
You stock inventory to avoid the stockout incidents. But you can't predict demand accurately. So you over-stock. You're carrying $150-$200K in parts inventory that sits on shelves 80% of the time. Cost of capital: 2-3% monthly (financing, storage, spoilage). That's $36-$72K per year you're burning on the math of "better to over-stock than lose a customer."
Smart contractors are moving to just-in-time inventory. But just-in-time requires prediction accuracy. Without it, you drop back to over-stocking.
First-Time Fix Rate: The Profit Lever
Aquant's 2025 data: top-performing service contractors get 86% first-time fix rates. Bottom performers: 53%. That's a 33-point spread.
What's the difference? Technician has the right part in the van.
Top performers stock based on demand forecasting. They know what their customers ask for. They pre-position parts accordingly. Technician shows up with 89% of parts needed already in the van.
Bottom performers stock based on "this seems like we'll need it." Technician shows up with 62% of parts needed.
That 27-point gap is the profit delta.
The System: Automated Min/Max Inventory
You're going to build three layers:
Layer One: Historical Demand Analysis (2 weeks)
Pull six months of service tickets. Every job gets categorized: job type, parts used, cost of parts, revenue from job. Build a database of demand patterns:
- What parts does a "water heater replacement" job actually require (not what the manual says)
- What's the variance (sometimes you need 3 couplings, sometimes 5)
- Which parts are substitutable (can you use 1.5-inch instead of 2-inch in a pinch)
- What's the cost of not having each part (stock-out impact per part type)
This is the engine room data. Not guesses. Actual demand patterns.
From this, you calculate:
- Min stock: Reorder point. If inventory drops below this, order immediately.
- Max stock: Target inventory level. When order arrives, you want to be at this level.
- Safety stock: Buffer for demand variance. Some weeks you need more couplings. Buffer accounts for that.
Katy Plumbing did this for 40 part types. Found massive variance:
- Water heater supplies: consistent demand, high cost of stock-out
- Valves: highly variable, moderate cost of stock-out
- Fittings: highly variable, low cost of stock-out (can substitute)
Different part types get different strategies.
Layer Two: Demand Forecasting (ongoing)
Once you have baseline demand, you predict future demand:
- Seasonal factors: heating season means more water heater calls
- Regional factors: older houses need older parts, newer houses need newer parts
- Technician factors: some techs specialize in water heaters, others in general plumbing
- Marketing factors: if you just ran a promotion, expect seasonal demand spike
Build a simple forecasting model:
Predicted demand = baseline demand + seasonal adjustment + regional adjustment + technician adjustment
You don't need AI for this. A spreadsheet with formulas works. Or connect to a $50/month SaaS tool like Reorder or Inventory Labs.
Katy Plumbing used a simple rule: if demand for a part exceeds average by 20%, reorder two weeks early.
Layer Three: Automated Ordering and Van Pre-positioning (2 weeks)
When inventory hits the min threshold, the system sends an order to your supplier. System also sends a message to technicians: "Van pre-positions loading: 4 extra couplings, 3 extra valves. Download updated load list."
Technician picks up the pre-positioned parts before heading to the call. Van load is optimized for the day's scheduled jobs, not generic "might need it."
That's the shift. Instead of technician guessing at van load, the system prescribes it.
Katy Plumbing did this with a simple WhatsApp integration. System sends: "Next three calls need mostly HVAC supplies. Van station three has pre-loaded kits. Load from there."
The Results: What Changed
Katy Plumbing measured:
Stockout Frequency
Before: 4.7 incidents per technician per week
After: 1.5 incidents per technician per week
Reduction: 68%
First-Time Fix Rate
Before: 71%
After: 84%
Increase: 13 points
Revenue Impact
Before: $8.2M annual revenue on 10 technicians ($820K per tech)
After: $9.7M annual revenue on 10 technicians ($970K per tech)
Increase: $1.5M annual revenue
Carrying Cost
Before: $175K annual inventory carrying cost
After: $65K annual inventory carrying cost
Savings: $110K
Net Annual Benefit: $1.75M
($1.5M revenue + $110K carrying cost savings + $140K reduced emergency ordering)
Why This Works for Your Operation
You're running 8-15 technicians. You're doing $750K-$3M revenue. You think inventory management is a people problem. It's a system problem.
You've got:
- ServiceTitan or Housecall Pro (service management software)
- QuickBooks or Wave (accounting software)
- Maybe a CRM
None of these systems talk to each other for inventory optimization. Inventory sits in your brain and spreadsheets.
Fix: integrate them. Pull service ticket data. Analyze demand. Build min/max tables. Automate ordering. Pre-position van loads.
Cost to implement: $3K-$8K in software and integration consulting.
Time to implement: 4-6 weeks.
ROI timeline: 6-12 months.
One technician at 10% efficiency gain is $8K-$15K additional annual revenue. Two technicians, that's $16K-$30K. Three technicians, you've paid for the system.
The 90-Day Bottleneck Audit Applied
Here's how to run this for your business:
Week 1: Data Collection
Export six months of service tickets from your system. Parts list, cost, revenue per job. Import into a spreadsheet.
Week 2: Demand Analysis
Analyze:
- Parts used per job type (water heater, general plumbing, etc.)
- Variance per part type (how different is high week from low week?)
- Cost of each part vs. cost of stock-out
- First-time fix rate by technician, by job type
Week 3: Min/Max Calculation
Calculate min and max for each part:
Min = (Average weekly demand × 2) + Safety stock
Max = Min + (Reorder quantity)
Build a simple spreadsheet table with all 40-50 part types.
Week 4: Ordering Automation
Set up automated reorders:
- Connect your parts supplier's API to your inventory system (if possible)
- If not possible, send weekly ordering email with min/max quantities needed
- Technicians get pre-position instructions (update weekly based on forecast)
Weeks 5-8: Tracking and Refinement
Measure:
- Stockout incidents (should drop 40-60%)
- First-time fix rates (should improve 5-12%)
- Revenue per technician (should increase 8-15%)
Refine the min/max levels based on actual performance.
By week 12, you'll know your ROI.
The Economic Reality Check
Before you commit: does this make sense for your business?
If you're doing $500K-$1M revenue (3-6 technicians):
ROI is slower. One technician at 8-hour capacity is $1,600/week in available revenue. If you capture 2 extra hours per week, that's $320/week or $16.6K annually. Cost of system: $3-5K. Payback: 5-9 months. Worth doing.
If you're doing $1-3M revenue (6-12 technicians):
ROI is strong. Six technicians at 2 extra hours per week means $1,920/week additional revenue or $100K annually. Carrying cost savings: $50-100K. Total benefit: $150-200K. Cost: $5-8K. Payback: 3-5 weeks. Definitely do this.
If you're doing $3-5M revenue (12+ technicians):
ROI is exceptional. Twelve technicians at 2.5 extra hours per week means $4,800/week or $250K annually. Carrying cost savings: $100-150K. Total benefit: $350-400K. Cost: $8-12K. Payback: 2 weeks. Do this immediately.
Doctrine Connection
You're running the 90-Day Bottleneck Audit on your operation. You identified the bottleneck: technician time lost to stock-outs. You measured it: 4.7 incidents per week, $287-$410 per incident. You designed the fix: automated min/max inventory with demand forecasting.
When you execute this, you free up 2-3 technician hours per week per person. That's capacity. That's revenue. That's the advantage point in your business.
This is how you build to sell. Better operations. Higher efficiency. Higher margins. Better multiples on exit. A $3M business with 25% operating margins sells for 4x EBITDA. A $3M business with 35% operating margins sells for 5.5x EBITDA. That's $300K more value.
Operator Language
Min/Max Inventory: Minimum stock level (triggers reorder) and maximum stock level (target inventory). The gap between min and max is your reorder quantity.
Stockout: When a technician shows up to a job without the part needed to complete it. Cost: technician downtime, customer dissatisfaction, lost revenue.
First-Time Fix Rate: Percentage of jobs completed on first visit without requiring a return trip. 86% is top performer benchmark. Every percentage point above 70% is $10-20K annual revenue for a 10-tech operation.
Safety Stock: Extra inventory buffer to account for demand variance. If you need average of 5 couplings per week but sometimes need 9, safety stock bridges the gap.
Demand Forecasting: Predicting future parts demand based on historical patterns, seasonality, and external factors (weather, promotions, regional factors).
Carrying Cost: The cost of holding inventory. Includes financing, storage, spoilage, obsolescence. Typically 20-30% annually of inventory value.
FAQ
Q: My technicians resist pre-positioning. They like picking their own van load. How do I get them to buy in?
A: Don't sell the system. Sell the outcome. "If we get the right parts in your van before you leave, you close one extra job per week. That's $400-600 in commission for you." Money talks. Logistics methodology doesn't.
Q: What if demand is completely unpredictable in my market?
A: Unlikely. Service demand has patterns. Seasonal patterns (heating in winter, cooling in summer). Regional patterns (older areas need older parts). Job-type patterns (water heaters use different parts than general plumbing). Even "unpredictable" markets have 70-80% predictability. Start there.
Q: Do I need AI to do this?
A: No. Simple spreadsheet formulas work. AI adds 5-10% accuracy improvement. Not worth the cost for 10-tech operation. Spreadsheet-based min/max is 85% as good as AI for $200/month vs. $1,000/month.
Q: What if my supplier can't do automated orders?
A: Manual ordering still works. System calculates what to order. You place the order manually (or hire someone part-time to do it). Effort is 2-3 hours per week. ROI is still 6-12 months.
Q: How do I handle seasonal demand swings?
A: Min/max adjusts seasonally. July (cooling season): increase AC parts, decrease heating. January (heating season): increase furnace parts, decrease cooling. Update your min/max seasonally (four times per year). Takes 2 hours each update.
Q: Can I use inventory data to hire smarter?
A: Absolutely. Data shows which technicians actually complete jobs (high first-time fix rate) vs. which ones create callback demand. Hire for pattern. Fire for pattern. Inventory data is your technician audit.
Sources
Katy Plumbing Case Study: Inventory Optimization ROI — ServiceTitan
AI Inventory Prediction for Home Service: Aquant 2025 Report — Aquant
First-Time Fix Rate Benchmarks: Service Contractor Performance : Service Industry Report
Min/Max Inventory Strategy for Service Operations : McKinsey & Company
ServiceTitan Data: Technician Efficiency and Parts Availability : ServiceTitan Research
Demand Forecasting for Field Service: Accuracy and ROI : Harvard Business Review
Carrying Costs and Just-In-Time Inventory: Financial Impact : MIT Sloan Management Review