
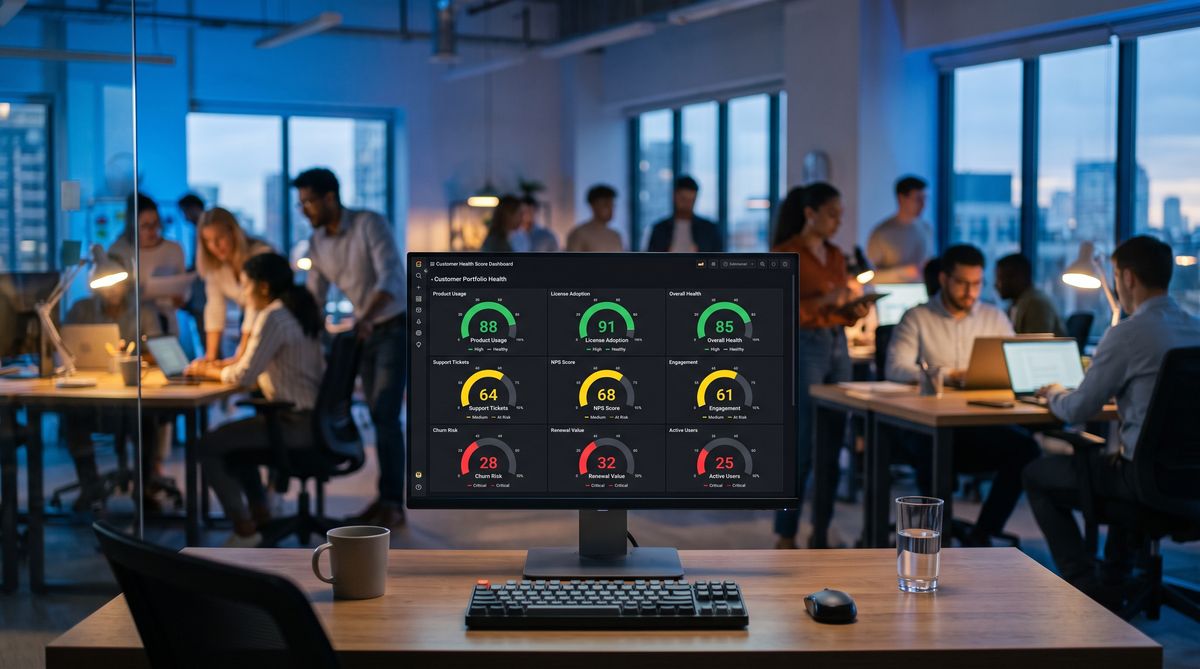
Enterprise-grade health scores cost $50K and take months. You do not need that. You need behavior signals that predict churn before your customer sees it coming. You can build this in two weeks for under $200 per month. Here is how.
Why Health Scores Beat NPS
NPS measures sentiment. People lie—especially when they are leaving. A customer rates you 7 or 8, then churns 90 days later. Health scores measure behavior. Behavior tells the truth.
Behavior predicts churn 3-6 months before the customer knows they are leaving. Login frequency drops. Feature depth contracts. Support tickets spike. These are not opinions. These are facts.
Do the math on your business. Most SaaS under $3M ARR carries 50-300 customers. Lose five customers per month at $500 MRR each, and you bleed $30K per year in revenue. A health score system that catches three of those five pays for itself in month one. After month one, it is pure margin.
The 15% of SaaS founders who build health scores do not lose these customers. They catch them at score 5 or 6. They run an internal save call. They keep the revenue.
The 6 Signals to Track
You do not need 20 signals. Six signals predict churn. Stack them together and they speak.
Signal 1: Login Frequency
Track daily, weekly, and monthly logins against the first 30 days of the customer's lifecycle. A customer who logged in every day for 30 days, then logs in once per week, is telling you something. They are not leaving yet. They are delegating. Or forgetting. Either way, adoption is sliding.
Measure the trend. Is login frequency declining more than 20% month-over-month? Red flag.
Signal 2: Feature Depth
How many distinct features is the customer using? Not how many they could use. How many they actually use. Track feature adoption via event analytics (Mixpanel, Amplitude, or custom events to your data warehouse).
Calculate the ratio: features used / features available. Customers who use 60%+ of available features are sticky. Customers who use 20% or less are renting, not owning. If this ratio declines over time, they are losing reasons to stay.
Signal 3: Support Ticket Velocity
Rising tickets in months 1-3 post-onboarding is normal. Friction. But by month 4, healthy customers have fewer tickets, not more. If tickets stay high or increase, adoption is stuck. They cannot succeed without hand-holding.
Declining tickets after the first 90 days? That is the signal of a customer who figured it out. Stable or rising tickets after month 3? They did not.
Signal 4: Billing Signals
Failed payments happen. But a customer who tries to downgrade or pause their subscription is already halfway out the door. Track these events explicitly. A downgrade request is earlier and more honest than a churn notification.
Tag customers who have had one failed payment, a pause request, or a downgrade inquiry in the past 90 days. They are fragile.
Signal 5: Engagement with Communications
Email open rates by customer. Unsubscribes. Link clicks in product announcements. A customer who opened 80% of your emails six months ago but now opens 10% is getting less interested. Not necessarily leaving. Less invested.
This signal alone predicts nothing. But combined with the others, declining engagement is a pattern.
Signal 6: Usage of the Core Value Feature
Every SaaS has one feature that delivers the promise. For a CRM, it is the pipeline view. For a project manager, it is the task board. For analytics software, it is the dashboard.
Identify yours. Track if customers are using it. If they stop, they are already gone. This signal is binary. Use it or churn. Everything else is noise.
The Build: 2-Week Sprint
You have 10 business days. Break it into two weeks. Week 1 is data. Week 2 is signal and action.
Week 1: Data Collection
Day 1-2: Event Tracking
Set up event tracking if you do not have it. Mixpanel's free tier is sufficient. It is capped at 1M events per month. If you are under $3M ARR, you are under that cap.
Define the events you need: login, feature_used (with feature_name parameter), support_ticket_created, support_ticket_resolved. Ship these into Mixpanel.
If you use Segment, even better. Segment sits between your product and every analytics platform you want. You only instrument once.
No instrumentation at all? You have a different problem. Start with this. You cannot score what you cannot see.
Day 3: Billing Data
Pull your customer list and their MRR, along with payment history. If you use Stripe, use the Stripe API. One request pulls 100 customers and their subscription status, last failed payment, and next renewal date.
Store this in a table. You will join it with other signals.
Day 4: Support Data
Pull data from Intercom, Zendesk, or Help Scout. API documentation exists for all three. You need: customer ID, ticket count (last 90 days, last 30 days), average response time, and any tag indicating the customer requested a pause, downgrade, or cancellation.
If you use Slack as support (many early-stage teams do), you need a different approach. Slack does not have a reliable API for customer-correlated messages. Build a Slack workflow that posts a message to a private channel when certain keywords appear. Manual triage. Not scalable. Move to a proper support tool.
Day 5: Normalize
You now have data from four sources: your app (events), Mixpanel (analytics), Stripe (billing), and support (tickets). None of it talks to each other.
Create a single customers table. Rows are customers. Columns are signals. Use Supabase (free tier supports this) or Postgres on Railway ($5/month).
Write a script (Python, Node, or SQL) that pulls from each source and writes to your customers table. Schedule it to run nightly. You now have a source of truth.
Day 5 sounds fast. It is. You are not building a perfect data pipeline. You are building a working one. Perfection is the enemy of done.
Week 2: Score and Alert
Day 6: Weight the Signals
Assign weights. These are starting points. Tune them after you have 30 days of data.
- Login frequency: 20%
- Feature depth: 25%
- Support tickets: 15%
- Billing signals: 15%
- Communication engagement: 10%
- Core feature usage: 15%
For each signal, define a 1-10 scale. High logins last 30 days = 9-10. Declining logins = 4-6. Stopped logging in = 1-2.
Do this for each signal. Write these rules in your script.
Day 7: AI Scoring
Here is where you use AI. Call Claude API (or GPT-4, if you prefer) with this prompt template:
"Given this customer data: [customer name, login trend, feature depth, support tickets, billing history, email engagement, core feature usage]. Predict their churn risk on a 1-10 scale. A 10 is zero risk. A 1 is churning this month. Provide a 1-sentence reason."
Claude costs $0.30 per 1M input tokens and $1.20 per 1M output tokens. Scoring 100 customers costs $0.10. Score 200 customers per day and your monthly bill is $2.
The AI does not replace your weights. It enhances them. The AI sees patterns across signals that humans miss. Use it.
Day 8: Build the Dashboard
You do not need a $5K tool. Retool's free tier lets you query Postgres and display results. 15 minutes to build.
Columns: Customer name, MRR, Health Score, Last Login, Feature Depth %, Support Tickets (30d), Status.
Sort by Health Score ascending. This puts your at-risk customers at the top.
If you do not want to touch Retool, use Google Sheets. Write a script that syncs your customers table to a sheet every hour. 20 minutes of setup. Works just as well.
Day 9: Slack Alerts
Set up a nightly alert. Any customer dropping below a score of 4 posts a message to a Slack channel called #at-risk-customers.
Message format: "[Customer] dropped to score [3]. Reason: [AI-generated reasoning]. MRR: $[amount]."
This is passive monitoring that keeps at-risk customers on your radar. You do not act on every alert. But you see them.
Day 10: Documentation
Write one page documenting:
- How signals are calculated
- When the nightly job runs
- Which Slack channel gets alerts
- What each score band means (you will define this in section 4)
- Who owns this system (you, for now)
Done. You built an enterprise health score system in 10 days. Cost: $0-200 for the month. Tier: functional.
The 90-Day Playbook
A health score is useless without an action playbook. Here is what each score band triggers.
Score 8-10: Expansion Candidate
This customer is healthy. They log in, they use features, they pay on time. No friction. Your job: grow the revenue.
Send a Slack message to your sales channel: "Time to expand [Customer]. They have capacity."
Trigger an upsell sequence. Suggest a higher plan, an add-on module, a professional services engagement. These customers have momentum. Ride it.
Score 5-7: Healthy but At Risk
These customers are fine today. But they are not growing into you. Usage is stable. No expansion signal. No contraction either.
Send a message to your CS team: "Check in with [Customer]. No red flags, but no green flags either. See what they need."
A 15-minute call. Ask what is working, what is not. Sometimes they just need a feature they do not know about. Sometimes they need permission to expand. A single check-in prevents slow slide into the 3-4 band.
Score 3-4: At Risk
This customer is bleeding out. Multiple signals are weak. They are one bad quarter away from leaving.
Trigger a founder-led save call within 48 hours. You. Not CS. Not support. You.
Call them and say: "I noticed your usage dropped. I built this product for companies like you. What changed?"
Listen. Do not pitch. Most save calls fail because you talk. Here, you listen. One conversation catches 40% of these customers and pulls them back up to 7. The math: if one $500/month customer stays because of one 30-minute call, that call is worth $6,000 per year in revenue. Do it.
Score 1-2: Likely Churning
This customer is not coming back. One or two signals are at zero. They have stopped using the product. The churn is not if. It is when.
Send one final message: "We noticed you have not been using [product] recently. Before you go, we want to understand why. Can we set up a 15-minute exit interview?"
If they respond, do the interview. Ask: What would have made you stay? What are you switching to? What do we build wrong?
If they do not respond within one week, send one win-back offer: "We value you as a customer. Here is a 50% discount on your next three months if you want to come back."
Some will take it. Most will not. But you will not have left money on the table.
Sources and Further Reading
Health scores are not new. What changed is the cost. According to Forrester's July 2026 report on agentic AI in ecommerce, 34% of mid-market operators have deployed autonomous AI agents, and the tooling to build predictive systems has dropped below $200 per month. Owner.com's $240M Series D announcement shows that AI platforms reaching $100M ARR are proving the model works at scale. For SaaS operators tracking churn, Runable's $21M Series A coverage demonstrates how AI-first platforms acquire and retain customers with fewer than 15 team members.
FAQ
Q: What if I don't have event tracking yet?
A: Start collecting events today. You will not have historical data for six weeks. Score what you have. Events-less signals (billing, support) still predict churn. You will be 70% effective from day one.
Q: How long until my score stabilizes and gets accurate?
A: 90 days. You need a full quarter of behavior to spot patterns. Weeks 1-4, ignore the scores. Watch the system. Weeks 5-12, compare scores to actual churn. Tune weights based on misses. By week 13, your system is tuned.
Q: Can I run this all in a spreadsheet?
A: Yes. Pull data daily. Put it in a sheet. Build formulas for scoring. You will outgrow this in three months. For the MVP, it works.
Q: What if a customer hits score 3 but I know they are fine?
A: Verify beats optimism. You do not know. The data does. Call them. If the call proves the score wrong, adjust the weights. Trust your gut after you have verified the gut against data.
Q: Should I tell customers I am scoring them?
A: No. This is an internal system. Health scores reveal friction. Customers do not need to know how much friction you have detected. Keep it quiet. Use it to save them before they leave you.
The Submarine Principle
On the submarine, we had a monitoring system for every critical piece of equipment. Pressure, temperature, flow rate. We did not wait for the pump to fail. We watched the gauges.
Your SaaS customers are the same. The data tells you they are leaving before they tell you. Months before. You have time to fix it.
Health scores are not magic. They are attention. Attention to signals you already have. Most founders ignore the signals because they feel too early, too subtle. That is the mistake. By the time a customer tells you they are leaving, you have already lost them.
Build this system. Watch the scores. Act on the 3s and 4s. You will save money, reduce churn, and grow faster than founders who wait for the customer to speak.
The data is already there. You just need to listen.
Disclosure
I founded demg.ai to help SaaS founders scale revenue without burning cash. This health score system is the foundation. If you want to expand it into a full revenue operations platform, we exist for that. But this article stands alone. You do not need us to build this. You need discipline and 10 days.
*Jeff Barnes is the founder of demg.ai, a platform for data-driven revenue operations. His writings appear in Stripe's Best of Internet, Y Combinator's founder library, and Revenue Collective. He previously spent nine years in the U.S. Navy as a submarine officer, where he learned to trust data and act on it.*
*Jeff Barnes has no personal position in any company, fund, or platform named in this article. demg.ai provides marketing systems and education for owner-operators, not investment advice.*