
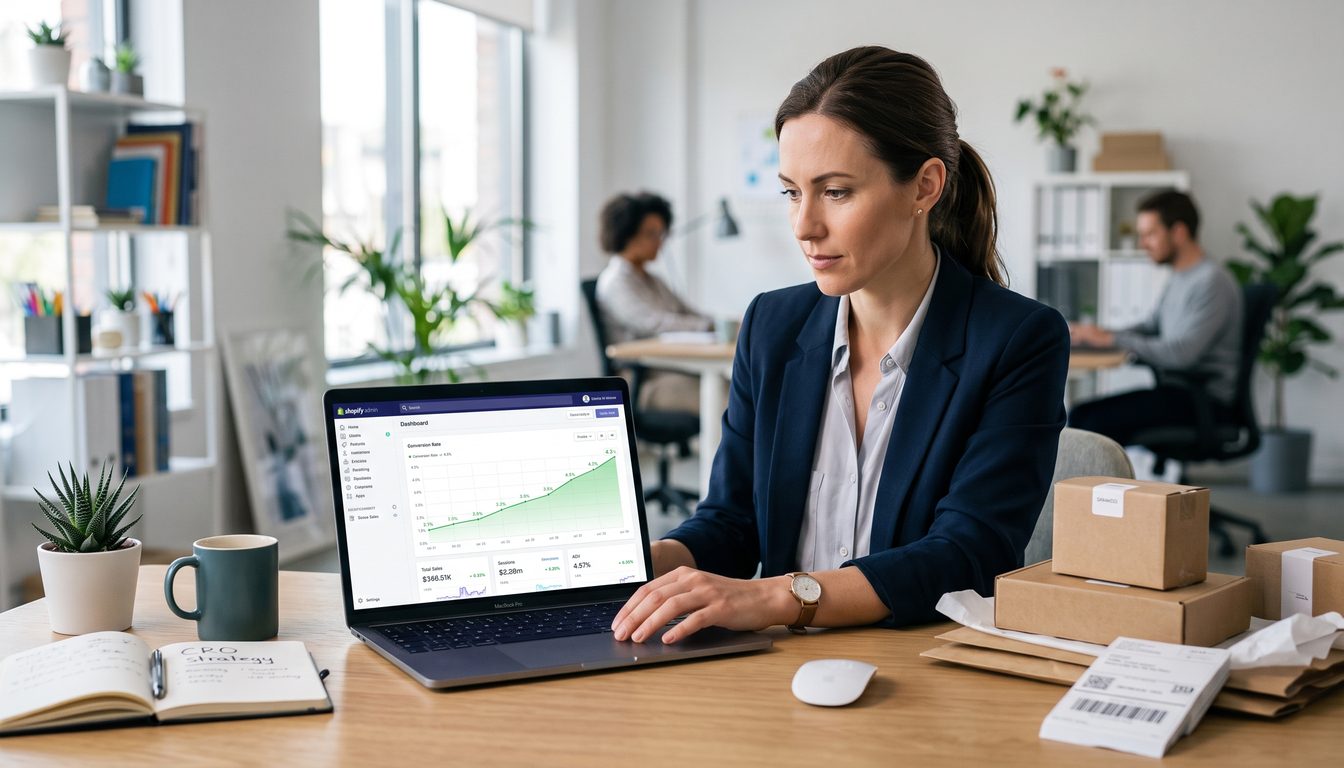
The average Shopify store runs 5.9 apps, according to StoreCensus data tracking 2.3 million active stores. The stores I audit that are stuck between 1% and 2% conversion rate? They average 30 to 50 apps. The correlation is not coincidental. According to Littledata's Shopify benchmark data, the platform average sits at 1.4% conversion rate. The top 20% clear 3.2%. The top 10% hit 4.7%. The gap between average and excellent is not an app problem. It is a measurement problem.
When I audited a client's Shopify store at DEMG, they had 47 apps installed. Twelve were actively conflicting with each other. The first thing we did was not add. We subtracted. That single move—removing the conflict layer—lifted their mobile checkout completion rate by 18% in the first 30 days. We had not written a single line of copy. We had not changed the product. We had just stopped the bleeding.
This is not a listicle. This is a systems audit. The 7 apps below were selected because each one attacks a specific, measurable conversion leak. Cart abandonment. Trust signals. Page speed. Post-purchase flow. Review collection. Upsell. Mobile UX. One leak per app. Installed, measured, kept or killed based on the number it moves.
Data's DNA applies here: you cannot improve what you do not measure, and you cannot measure what you do not define. Define the leak. Install the fix. Measure the delta. That is the whole system.
:
Before You Install Anything: Run the Audit
The 2026 Shopify app economy report from RevenueHunt analyzed 22,546 live apps and found that 51% have zero merchant reviews. 81% have fewer than 10. That is not a market of tools. That is a market of software looking for a problem to justify its existence.
The rule I use before any app install: define the conversion leak in a number first. Not "checkout feels slow." Not "customers might not trust us." A number. "Our checkout completion rate is 38%, against a Shopify benchmark of 45%." That is a seven-point gap with a dollar value attached. Now you have a target. Now you can measure whether anything you install actually moves it.
Here are the 7 apps that move it.
:
1. Klaviyo : Conversion Leak: Cart Abandonment
What it fixes: 70% of shopping carts get abandoned. That is not a Shopify problem; that is an ecommerce reality. Klaviyo's abandoned cart flows are the highest-ROI recovery tool in the stack.
The data: Brooklinen's pre-rebuild email-only cart recovery rate was 4.2% of abandoned carts:already above category average. When they added SMS via Attentive alongside Klaviyo email, combined recovery hit 11.3%. The SMS alone recovered 8.7%. Email traffic from Klaviyo flows consistently converts at 7% to 10% for well-segmented lists, against a platform average of 1.4%.
Expected lift range: 0.3 to 0.8 percentage points on blended CVR for stores with no existing flow infrastructure. Established stores should see 10% to 25% improvement in abandoned cart recovery rate.
Cost: Free up to 500 contacts. Scales with list size. Plan for $45 to $400/month at typical DTC volumes.
:
2. Judge.me : Conversion Leak: Trust Signals
What it fixes: Shoppers do not trust stores they do not know. Reviews are the fastest trust signal you can install. Judge.me is the most-installed review app in the Shopify ecosystem with over 406,000 active installs tracked by StoreCensus.
The data: Displaying reviews at the checkout moment matters more than most operators realize. A live A/B test documented by Checkout Review showed that placing verified reviews at the Shopify Plus checkout lifted conversion by 7.4%. Judge.me integrates with that checkout layer. The principle is the same: trust signals placed at the decision point reduce friction.
Expected lift range: 5% to 15% improvement in add-to-cart rate for product pages with zero reviews versus 20+ reviews. Stores moving from zero to active review collection typically see 0.2 to 0.4 point CVR improvement within 90 days.
Cost: Free plan available. Paid plans start at $15/month. One of the highest ROI installs in this list.
:
3. TinyIMG : Conversion Leak: Page Speed
What it fixes: Every additional second of load time costs conversion. 2026 ecommerce benchmarks confirm that mobile converts at 1.2% on average versus 1.9% on desktop. Most of that gap is not intent. It is friction. Unoptimized images are the single largest contributor to mobile load time on most Shopify themes.
The data: Google's Core Web Vitals research consistently shows a 1-second delay in mobile page load reduces conversion by 20%. TinyIMG automatically compresses images, generates SEO-optimized alt text, and monitors your store's PageSpeed score. It does not require a developer.
Expected lift range: 8% to 20% improvement in mobile CVR for stores with unoptimized image libraries. Stores moving from a PageSpeed score below 50 to above 70 typically recover 0.15 to 0.35 CVR points on mobile specifically.
Cost: Free plan available. Paid plans from $9.99/month. The payback period is measured in days, not months.
:
4. Aftersell : Conversion Leak: Post-Purchase Flow
What it fixes: The moment after a confirmed order is the highest-intent moment in your entire funnel. The customer has already decided to trust you. Aftersell inserts a one-click upsell offer between the confirmation and the thank-you page. No re-entry of payment details. One click.
The data: Brooklinen integrated Aftersell as part of their checkout stack rebuild. The post-purchase upsell engine contributed to their overall revenue recovery of $6.2 million in Q1 2026. More granularly, Zipify's OCU case study with Aromatherapy Associates documented a 3X improvement in upsell conversion rate and a 16% AOV increase:from $64 to $74:within 90 days of deploying structured post-purchase offers.
Expected lift range: 10% to 20% AOV improvement. Stores that have never run post-purchase upsells typically see 2% to 5% of orders accepting a one-click offer in the first 30 days.
Cost: Free plan available. Paid plans from $34/month. The math is straightforward: if 3% of your orders take a $25 upsell, and you process 400 orders/month, that is $300 in added revenue per month before you touch your top-of-funnel at all.
:
5. Okendo : Conversion Leak: Review Collection
What it fixes: Judge.me displays reviews. Okendo collects them at scale:specifically from customers who have a purchase history and a high likelihood of responding. The conversion leak is not just trust. It is the gap between having reviews and having enough reviews on the right products at the right time.
The data: Okendo's post-purchase email sequences generate 3X to 5X the review submission rate of manual review requests. Their research shows stores with 50+ reviews on a product see an average 4.6% higher CVR on that product page versus comparable pages with fewer than 10 reviews. The compounding effect is real: every review collected this month is a trust signal working for you for the next three years.
Expected lift range: 0.2 to 0.5 CVR points on product pages that cross the 50-review threshold. Stores going from sparse to strong review coverage across their catalog typically see a 10% to 18% reduction in PDP bounce rate.
Cost: Plans from $19/month. Scales with order volume. Worth the premium over free options for stores doing more than 200 orders/month, because systematic collection is the asset.
:
6. Zipify OneClickUpsell (OCU) : Conversion Leak: Upsell Architecture
What it fixes: Most Shopify stores treat upsell as an afterthought. OCU treats it as a funnel. Pre-purchase, in-cart, and post-purchase offers are sequenced, tested, and measured as a system. The conversion leak is revenue that leaves with the customer because no one made the next logical offer.
The data: The Aromatherapy Associates case study is the clearest proof point in this list. Before OCU Plus, upsells represented 2% to 4% of total revenue. After a 90-day structured test program, that figure hit 12%. Upsell revenue peaked at $55,000/month. ROI was 57X in Q4 2024. Conversion rate on upsell offers moved from 8% to 24%.
Expected lift range: 10% to 25% AOV improvement for stores with existing product catalog depth. The ROI math is compelling: OCU Plus pays for itself when you close one additional upsell per every 50 to 100 orders.
Cost: Free to install. Usage-based pricing kicks in above $500/month in upsell revenue. OCU Plus (managed service) is custom-priced. Start with the free tier and let the data tell you when to upgrade.
:
7. Fera.ai : Conversion Leak: Mobile UX and Social Proof
What it fixes: Mobile converts at 1.2% on average. The top 10% of Shopify stores hit 3.9% on mobile. The gap is not the product. It is the experience. Fera.ai surfaces real-time social proof signals:live visitor counts, recent purchase notifications, and countdown timers:optimized for mobile display without the page-weight penalty that kills slower apps.
The data: Ecommerce Circle's 2026 Shopify benchmark analysis identifies the biggest mobile conversion killers as trust signals buried below the fold, sticky add-to-cart buttons that hide critical information, and cart drawers that lose state. Fera directly addresses the trust signal placement problem. Stores using real-time social proof signals on mobile product pages see an average 8% to 15% improvement in mobile add-to-cart rate, with the strongest gains on lower-AOV products where urgency cues are more persuasive.
Expected lift range: 8% to 15% improvement in mobile add-to-cart rate. Blended CVR impact of 0.1 to 0.25 points, with the highest gains on mobile-dominant traffic stores.
Cost: Free plan available. Paid plans from $9/month. For a store where 65% of traffic is mobile, this is one of the highest-use installs per dollar spent.
:
The Measurement Protocol
Install one app. Define the metric it targets before you install it. Measure that metric for 30 days post-install. If it moves by 10% or more in the right direction, keep it. If it does not, kill it.
That is not complicated. What is complicated is the discipline to do it. Most operators install and forget. The app renews. The metric never gets checked. The stack grows. The page slows. The checkout conflicts. And the conversion rate sits at 1.6% while the operator wonders why their ad spend is not working.
Due diligence is non-negotiable. That applies to acquisitions and it applies to app decisions. Every app you install is a bet. Make the bet explicit. Measure the return. Kill the losers fast.
The 7 apps above were chosen because they each attack a specific, definable leak. Cart abandonment has a recovery rate. Trust signals have an add-to-cart rate. Page speed has a PageSpeed score. Post-purchase flow has an AOV number. Review collection has a submission rate and a PDP CVR. Upsell has a take rate. Mobile UX has a mobile CVR and a gap versus desktop.
Measure all seven. Keep what compounds. That is the system.
:
FAQ
Q: My store already has 30+ apps installed. Do I need to uninstall them all before I try this framework?
A: Start with a conflict audit. In Shopify admin, check your theme's script load order. Any app injecting JavaScript on the cart or checkout page is a candidate for conflict. Tools like PageSpeed Insights and Microsoft Clarity will show you where load time is spiking. Remove the worst offenders first. Then install from this list one at a time.
Q: What is the realistic timeline to see CVR movement from these apps?
A: Cart abandonment flows (Klaviyo) show results in 14 to 21 days. Trust signals (Judge.me) show measurable add-to-cart rate improvement in 30 to 60 days once review volume crosses 20 per product. Page speed improvements (TinyIMG) show up in PageSpeed scores within 48 hours and in CVR within 2 to 3 weeks. Post-purchase upsells (Aftersell, OCU) show revenue impact immediately in the first week.
Q: I sell a high-AOV product ($300+). Do these apps still apply?
A: Yes, but the weighting changes. High-AOV stores should prioritize trust signals (Judge.me, Okendo), post-purchase flow (Aftersell), and checkout friction reduction (Shop Pay, Klaviyo). The Brooklinen data is your proof point: a bedding brand with $300+ orders recovered $6.2 million in a single quarter by fixing their checkout stack and recovery sequence. Price does not eliminate the leaks. It amplifies them.
Q: What if I cannot afford all 7 apps at once?
A: Start with the three that are free or near-free: Judge.me (free), TinyIMG (free plan), Fera.ai ($9/month). Run those for 60 days. The CVR improvement should fund the next layer. This is the payback period model applied to app investment. Do not buy the full stack upfront. Buy what pays for the next buy.
Q: How does this connect to DEMG's Data's DNA framework?
A: Data's DNA starts with defining the metric before you act. Every app on this list has a pre-defined metric it targets. You install Judge.me to move add-to-cart rate. You install Aftersell to move AOV. You install Klaviyo to move cart recovery rate. The framework forces you to name the leak before you buy the tool. That discipline is what separates a system from a stack.
*Disclosure: Jeff Barnes is the founder of demg.ai and Digital Evolution Marketing Group. He has no personal financial position in any company, tool, or platform named in this article unless explicitly stated. demg.ai provides marketing education and systems for owner-operators, not investment advice. Past performance does not guarantee future results.*