The first seven days determine whether a user stays. Fix them and you cut churn 30%. Ignore them and you are burning acquisition budget on users who will never convert. AI-personalized onboarding is not a nice-to-have in 2026. It is the highest-ROI growth investment on your roadmap.
The average SaaS activation rate sits at 37.5%. That means roughly two-thirds of every user who signs up never experiences the value you built the product to deliver. You paid to acquire them. They showed up. Then the product failed them inside a week.
That is the engine room problem. Not marketing. Not sales. Onboarding.
Why the First 7 Days Are Non-Negotiable
Users who do not engage within the first three days have a 90% chance of churning. That is not a soft trend — it is a hard number from Loyalty.cx's 2025 retention dataset.
Amplitude's 2025 Product Benchmark Report, spanning 2,600-plus companies, found that more than 98% of new users churn within two weeks if they miss a real value milestone. The math is brutal. At a $900 CAC and a 75% week-one drop rate, $675 of every $900 you spend is gone before month one closes.
The payback period on fixing this is near-instant. Customers who hit first value inside 14 days retain at 80%-plus at month 12. Customers who miss it retain at only 35–50%. That is a 30-to-45-point swing on a single variable.
You are not fixing a UX problem. You are repricing your retention curve.
The ATLAS Model: A 7-Day Activation Framework
Here is the framework we use to structure AI-powered onboarding sequences. Five phases. Seven days. One north-star metric: the activation event.
A — Assess (Day 0–1): Capture intent at signup. Ask three to five questions maximum. What is their role? What is their primary use case? What does success look like in 30 days? Feed these signals into your segmentation engine. Do not ask 14 questions. Five is the ceiling.
T . Trigger (Day 1–2): Fire the first behavior-triggered tutorial within 24 hours of the activation gap. If a user has not completed the core setup step, the system acts . not a human. AI tools like Userpilot and Chameleon can trigger contextual in-app guidance based on what a user has and has not done. This is not a reminder email. It is a precision prompt at the exact friction point.
L . Lead to Value (Day 2–4): Route each user to their fastest path to the aha moment. A solo founder and a 50-person ops team have different first-value milestones. AI segmentation builds separate paths. Products that deliver the aha moment within five minutes show 40% higher Day-30 retention than those requiring 15-plus minutes.
A . Accelerate (Day 4–6): Double down on users showing engagement signals. Surface the next feature that maps to their stated goal. This is where behavior-based email sequences earn their keep. Customer.io and similar tools fire these automatically. No manual queue. No sales bottleneck.
S . Score (Day 6–7): Run a health score check on every new account. AI platforms like Gainsight, Vitally, and ChurnZero update scores in real time based on login frequency, feature adoption depth, and support ticket sentiment. Any account below threshold triggers an automated playbook . not a panicked CSM scramble on day 30.
The ATLAS model is a system. Systems compound. Heroics do not.
What to Measure: The 5 Activation Metrics That Matter
Most teams track logins. Logins are vanity. Here are the five metrics that predict whether a user stays:
1. Time-to-First-Value (TTV): How many hours or days from signup to the first meaningful activation event. Target: under seven days for B2B SaaS of moderate complexity. Top performers hit it in under 24 hours.
2. Day-7 Retention Rate: The single strongest predictor of long-term retention in Amplitude's 2,600-company dataset. When at least 7% of a new cohort returns on day 7, the product sits in the top quartile for activation. Below that, you are in the bottom three-quarters of the market.
3. Activation Rate: The percentage of new signups who complete your defined activation event. Industry average: 37.5%. Target: 80%-plus for top-performing onboarding. Boosting activation by 25% can increase revenue by 34%.
4. Onboarding Completion Rate: How many users complete the full onboarding sequence. Completed-onboarding users have a 21% higher product adoption rate and are 12% less likely to churn in year one.
5. Health Score at Day 7: A composite of the above plus support interaction, setup depth, and feature breadth. Any account with a red or amber score needs an automated intervention . not a calendar invite.
Track these. Build dashboards around these. Your quarterly business review should open with these.
How to Build Adaptive Onboarding Sequences
Adaptive sequences are not branching email trees. They are event-driven systems that change based on what a user does . or fails to do.
Here is the architecture:
Step 1 . Define your activation event. One event. Not five. The single action that correlates most strongly with 90-day retention. For a project management tool, it might be the first task assigned to a teammate. For a CRM, it might be the first deal stage update. Get the data from your cohort analysis. Build around the signal, not the feature you want them to use.
Step 2 . Map the friction points. Run a drop-off audit on your current onboarding flow. Where do users stop? Most products lose 60–70% of signups inside the first 30 days because users hit a setup wall and walk. The friction point is usually in the first three steps.
Step 3 . Build role-based paths. Role-targeted onboarding messaging increases activation rates by 30–50%. If you are sending the same flow to a VP of Sales and a developer, you are sending the wrong message to both. Segment on role, company size, or stated use case. Build three paths minimum.
Step 4 . Wire behavior triggers. Every gap in the activation funnel needs a trigger. User did not complete profile setup by hour 24? Trigger an in-app tooltip. Did not invite a teammate by day 3? Trigger a behavior-based email with a one-click invite link. The system should act before the user has time to decide they do not need the product.
Step 5 . Deploy health scoring. Stand up a health score model on day one of any new customer account. Use a platform that pulls from product usage, billing, and support data. Set threshold alerts. When a score drops below 60%, fire a playbook automatically. Do not wait for the renewal conversation.
The AIN Story: What Happens When You Run the System
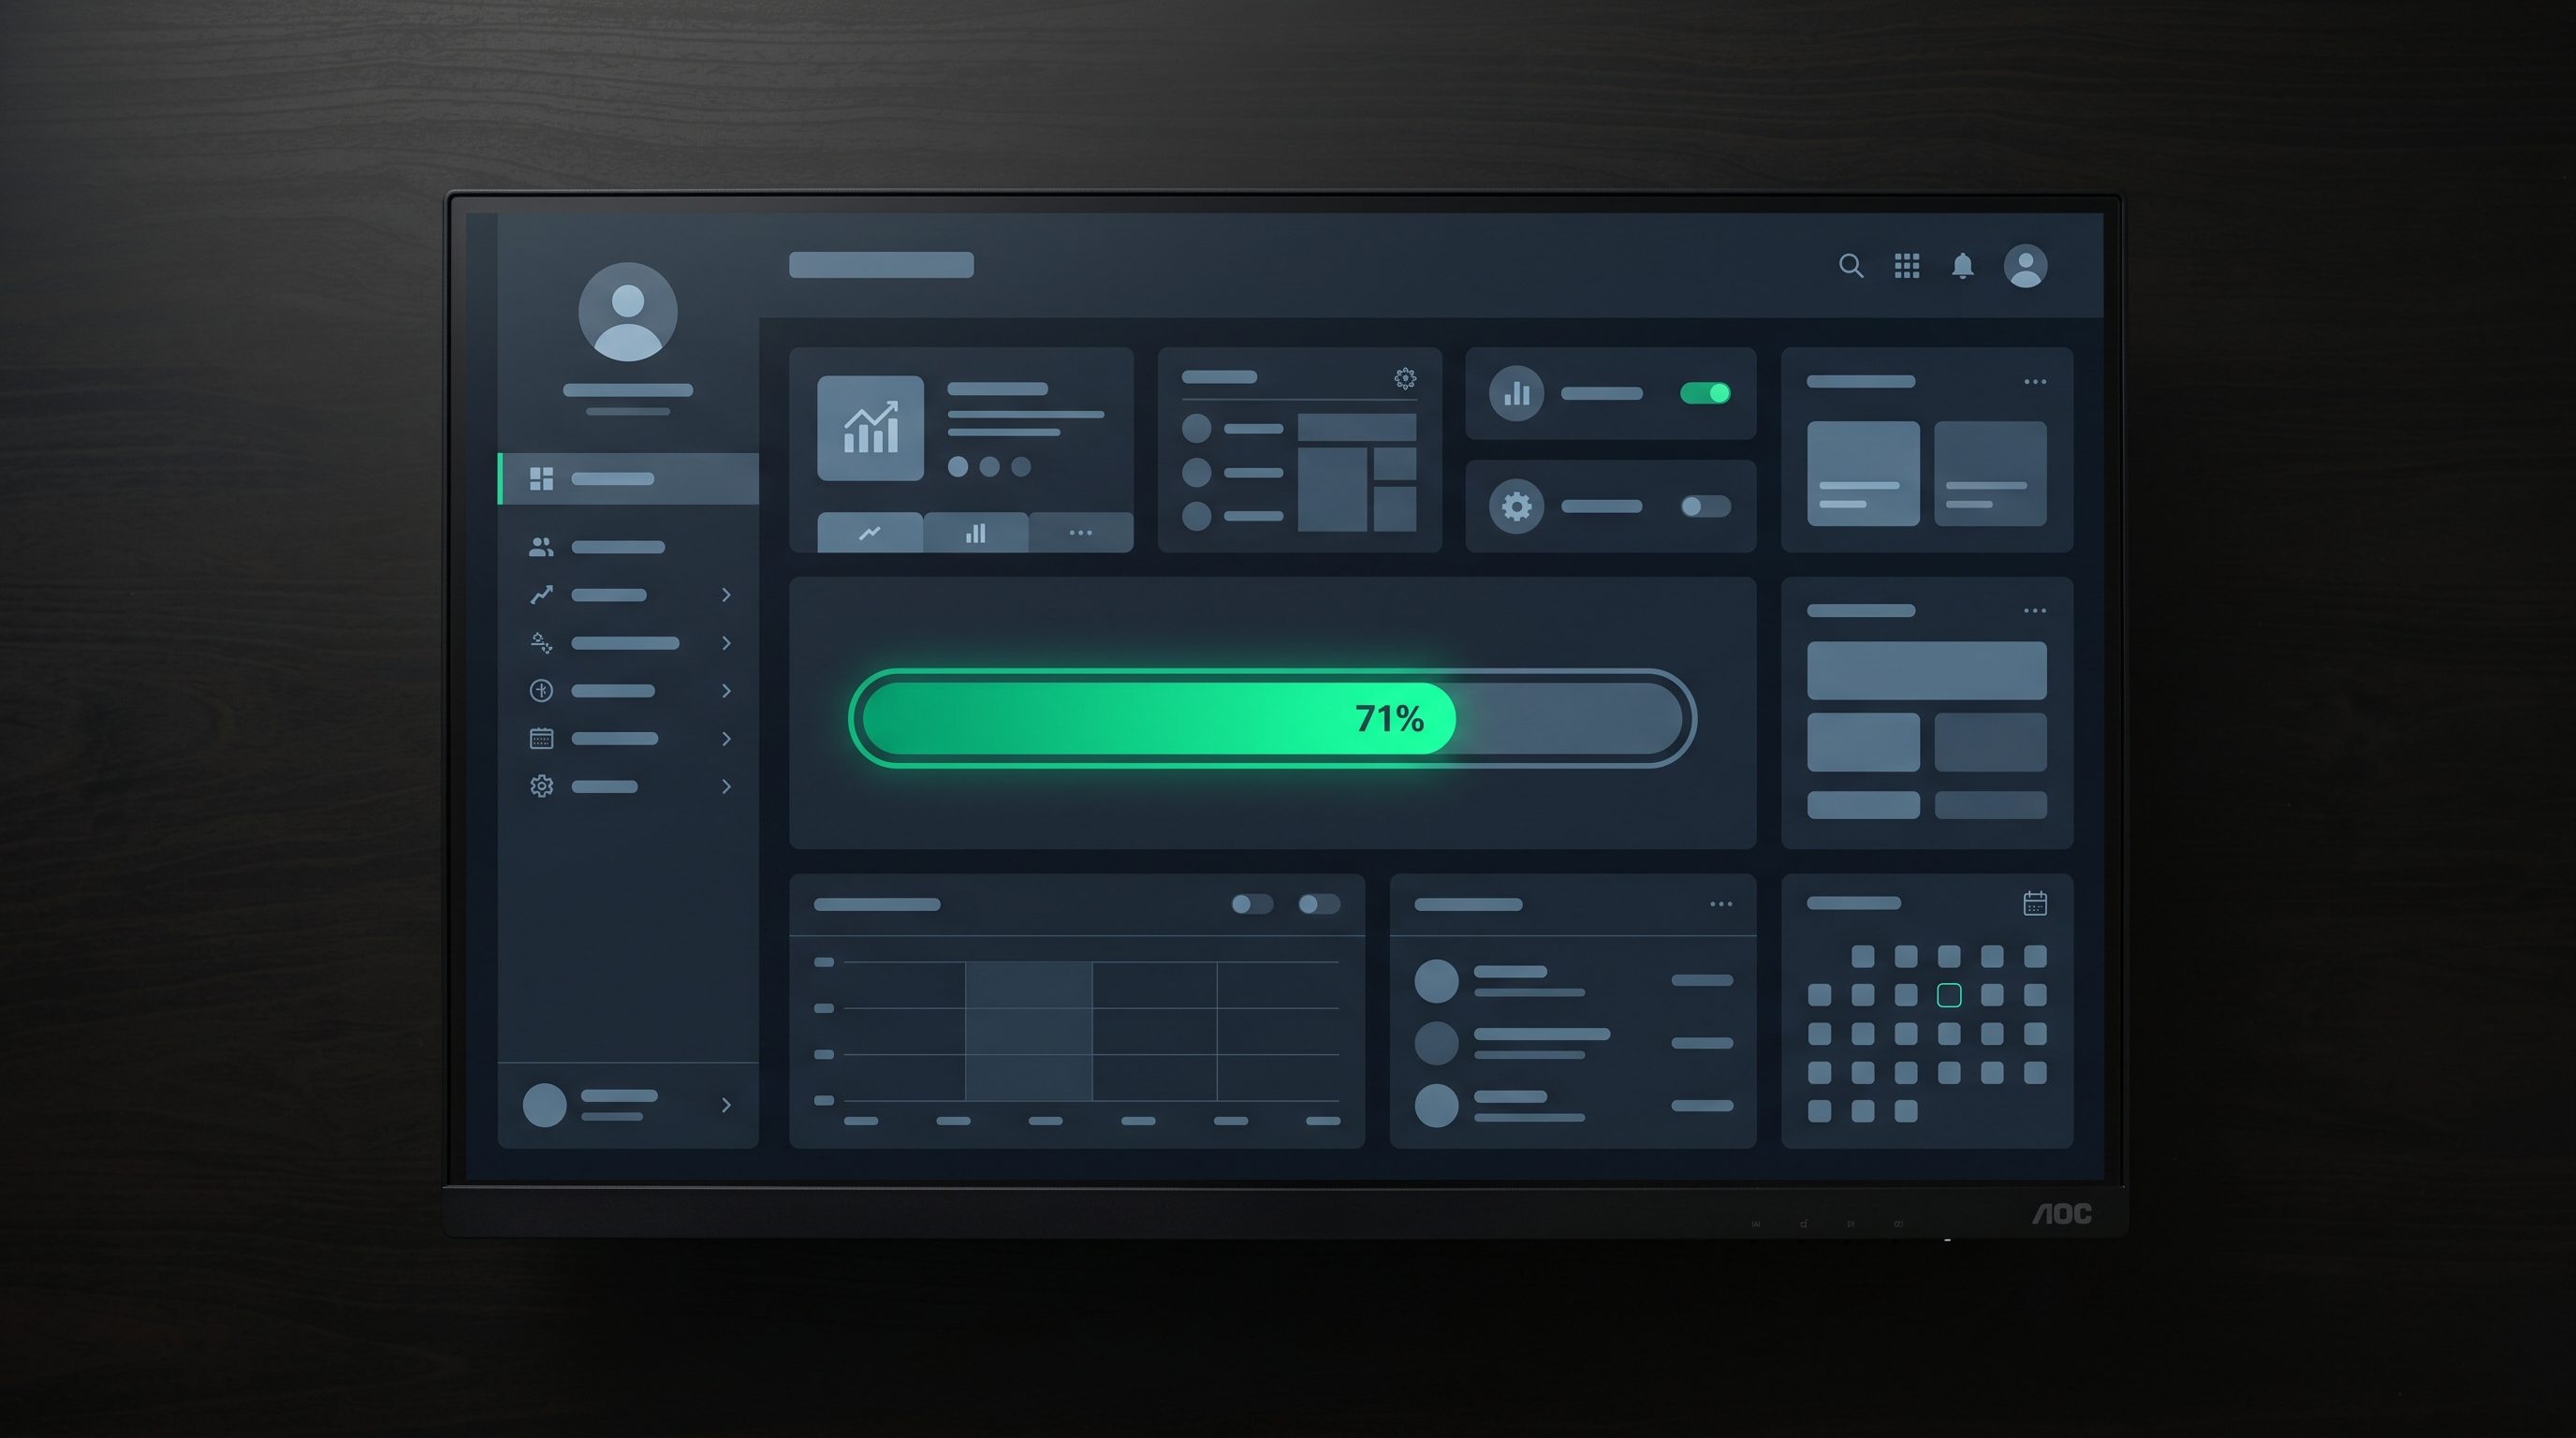
When we rebuilt AIN's investor onboarding, the intake form had 14 fields. Fourteen. Every field was a decision point where a user could decide the process was not worth their time.
We cut it to five. We added a progress bar. The system asked for only what was needed to route the user to their first value milestone.
Completion rate jumped from 34% to 71%. The system did the work, not the sales team.
That is the payback period on process investment. One change. One system. Doubled throughput. Nobody had to work harder. The bottleneck was not effort . it was friction.
Process beats ego. Every time.
The Tools Stack for AI Onboarding in 2026
You do not need to build this from scratch. The infrastructure exists. Here is what the best-in-class stack looks like:
In-app guidance: Userpilot or Chameleon for behavior-triggered contextual flows. Pendo for teams that need AI Smart Guides plus NPS correlation built in.
Email and lifecycle automation: Customer.io for event-driven onboarding sequences. Intercom for combined in-app messaging and email with AI-assisted targeting.
Health scoring and churn prediction: Gainsight or Vitally for enterprise-scale customer health models. ChurnZero for mid-market teams that need real-time churn risk alerts with lower implementation overhead.
Data and event tracking: Segment or Amplitude as the instrumentation layer. Every trigger, every health score, and every activation event needs clean event data flowing underneath it. This is the unglamorous work. It is also the work that makes everything else function.
An AI-first team can have this infrastructure deployed in four to eight weeks. Not three to six months. The ROI clock starts the day the first adaptive sequence fires.
The Benchmarks: What Good Looks Like
Stop measuring your onboarding against your own last quarter. Here is the external benchmark set:
- Activation rate target: 80%-plus. Industry average is 37.5%. Top performers more than double the mean.
- Day-7 retention: 7%-plus of new cohort returning on day 7 puts you in the top quartile.
- Time-to-first-value: Under seven days for B2B SaaS. Under 24 hours for PLG products.
- Net Revenue Retention (NRR): 110%-plus is the threshold for a healthy, compounding SaaS business. AI-embedded activation and retention flows drive 20–40% improvements in NRR.
- Onboarding completion rate: 65%-plus. Personalized flows hit 65% completion versus 40% for generic flows.
- Monthly churn: Below 2% for top performers. Industry average sits at 3.5%.
If you are below any of these benchmarks, your onboarding sequence is the first place to look. Not your acquisition channel. Not your pricing. Onboarding.
The Compounding ROI Case
Here is the math owner-operators need to run:
If your current activation rate is 37% and you lift it to 60%, you are retaining 23 more users out of every 100 signups. At $200 MRR per account, that is $4,600 in preserved monthly recurring revenue per 100 signups. Compounded over 12 months with a 90%+ retention rate on activated users, the number grows.
A 25% improvement in activation rates correlates with a 34% revenue increase. That is not a projection. That is benchmark data from Agile Growth Labs' 2025 activation study.
This is not a marketing investment. It is a retention investment. The payback period on a properly built AI onboarding system is typically under 90 days.
The system compounds. The heroics do not.
FAQ
Q: What is the single most important metric to track in the first seven days of onboarding?
Day-7 retention rate. Amplitude's data across 2,600-plus companies shows it is the strongest cross-temporal predictor of three-month retention. If at least 7% of a new cohort returns on day 7, you are in the top quartile. Build everything else around hitting that threshold.
Q: How many onboarding paths do I actually need?
Three at minimum. Segment by role or primary use case. A VP of Sales, a developer, and a solo founder need different first-value milestones. Role-targeted onboarding increases activation rates by 30–50%. Generic flows cap out at 65% completion versus 40% . a gap you cannot close with better copy.
Q: When should AI intervene in the onboarding flow versus a human CSM?
AI handles everything in the first seven days that is trigger-based: setup nudges, feature introductions, behavioral emails, and health score monitoring. A human CSM enters only when a health score drops below a defined threshold or when an account signals expansion intent. If your CSM team is manually managing day-one onboarding, that is a bottleneck masquerading as customer service.
Q: What is a realistic timeline to build and deploy an AI onboarding system?
Four to eight weeks for a team with clean event data already instrumented. The most common delay is upstream: undefined activation events and no cohort data to inform path design. Start with the activation event definition before you touch any tool. The rest follows.
Q: What does a healthy NRR look like for a SaaS business with strong onboarding?
110%-plus is the floor for a business where onboarding is doing its job. Top performers push to 120%-plus by combining AI-driven churn detection with proactive expansion triggers built into the onboarding sequence itself. When onboarding surfaces the right advanced features at the right moment, upsell happens without a sales motion.
Doctrine Connection: Process Beats Ego
Every founder who has rebuilt their onboarding wants to believe the product sells itself. It does not. The process sells it.
The activation data is not ambiguous. Users who hit first value in seven days stay. Users who do not, leave . regardless of how good the product is on day 30. The product's quality is irrelevant to a user who churned on day five.
Building an AI onboarding system is an act of process discipline. You are deciding that a repeatable, measurable system will do more for retention than the best salesperson or the most attentive CSM. The data backs that decision every time.
Process does not care about ego. It cares about the activation event. Build the system. Measure the day-7 rate. Iterate on the bottleneck. That is how compounding works.
*Jeff Barnes is the founder of DEMG.ai and has been building marketing systems for owner-operators since 2023. He has no commercial relationship with any tool or platform named in this article unless explicitly stated. This content is educational, not professional advice. Your results depend on your execution.*